🎯 Learning Objectives
By the end of this lesson, learners will:
- Recognize how different industries apply Power BI
- Translate business challenges into reporting use cases
- Appreciate the impact of visual storytelling on decision-making
📘 Why This Lesson Matters
While previous lessons introduced what Power BI is, this lesson will show you why it matters—by exploring how it’s actually used. Business leaders today don’t just want data—they want insights. Power BI empowers users to connect data from many sources and communicate it visually in a way that influences decisions.
🏢 Industry Use Cases (Expanded)
🛍️ Retail: Customer Purchase Behavior & Inventory Optimization
Scenario: A clothing chain wants to align inventory with seasonal demand.
Power BI Features Used:
- Time series visualizations of daily/weekly sales
- Geographic filters to compare store performance by location
- Predictive analysis on top-selling SKUs
Outcome:
Reduced stockouts, better vendor negotiation, and optimized marketing campaigns.
✈️ Airlines: Flight Delay Analytics
Scenario: An airline wants to improve on-time departure rates.
Power BI Features Used:
- Dashboards with KPIs like average delay per airport
- Filtering by aircraft, route, or weather conditions
- Trend analysis to identify recurring bottlenecks
Outcome:
Faster issue detection and improved customer satisfaction.
🏦 Banking: Risk & Fraud Monitoring
Scenario: A bank wants to flag high-risk transactions in real-time.
Power BI Features Used:
- Integration with SQL databases for live data feeds
- Custom alerts and conditional formatting
- Role-based access to protect sensitive data
Outcome:
Lower fraud losses and faster audit responses.
📚 Education: Student Performance Dashboards
Scenario: A university tracks student outcomes to identify at-risk learners.
Power BI Features Used:
- Embedded reports into LMS (Learning Management Systems)
- GPA trend visualization by department
- Drill-throughs for detailed student profiles
Outcome:
Improved retention rates and early interventions.
⚙️ Construction & Real Estate: Project Monitoring
Scenario: A real estate company tracks project timelines and cost overruns.
Power BI Features Used:
- Project milestone visualization with Gantt charts
- Budget vs. actual cost dashboards
- Cross-filtering by region, contractor, or project phase
Outcome:
Better budgeting, planning, and contractor performance tracking.
🧠 How to Identify a Power BI Use Case
Use this simple framework:
|
Step |
Question |
Example |
|
1. Business Problem |
What decision or issue are we trying to improve? |
High employee turnover |
|
2. Data Source |
Where is the data coming from? |
HR system, Excel, exit interviews |
|
3. User Role |
Who needs to see this insight? |
HR Manager, Department Heads |
|
4. KPI or Metric |
What should the dashboard highlight or track? |
Turnover rate by manager |
|
5. Expected Outcome |
What action or improvement should this insight drive? |
Targeted retention strategies |
🧪 Hands-on Activity Idea
Exercise: Think of a business, department, or non-profit you’re familiar with.
- Identify one key decision they need to make regularly.
- What data would help inform that decision?
- Sketch out what kind of report or dashboard you’d build using Power BI.
You can do this in a simple table or on paper.
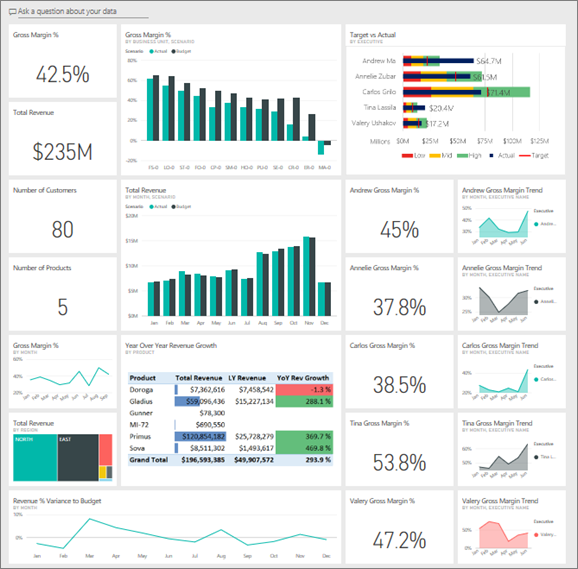
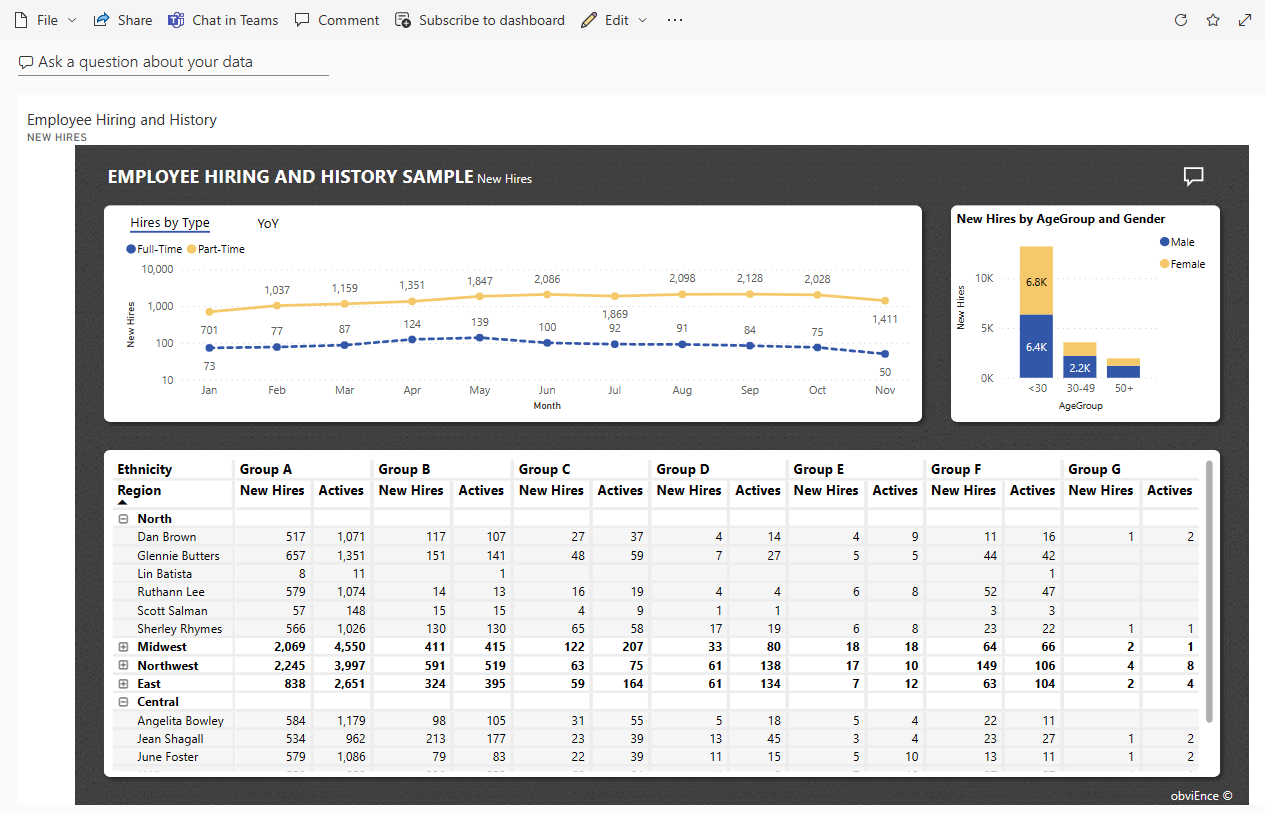
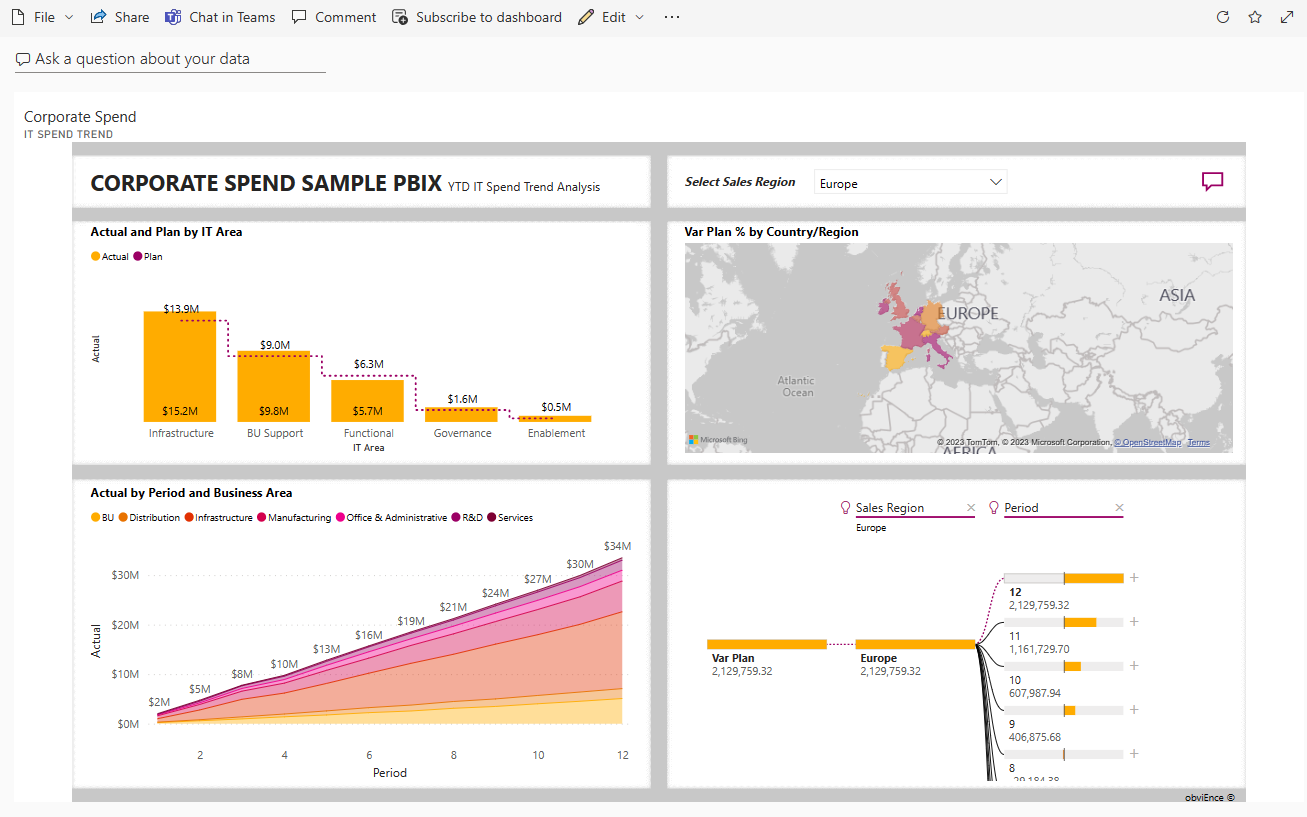
📊 Example Visuals to Use in the Lesson
- Retail Sales Overview Dashboard
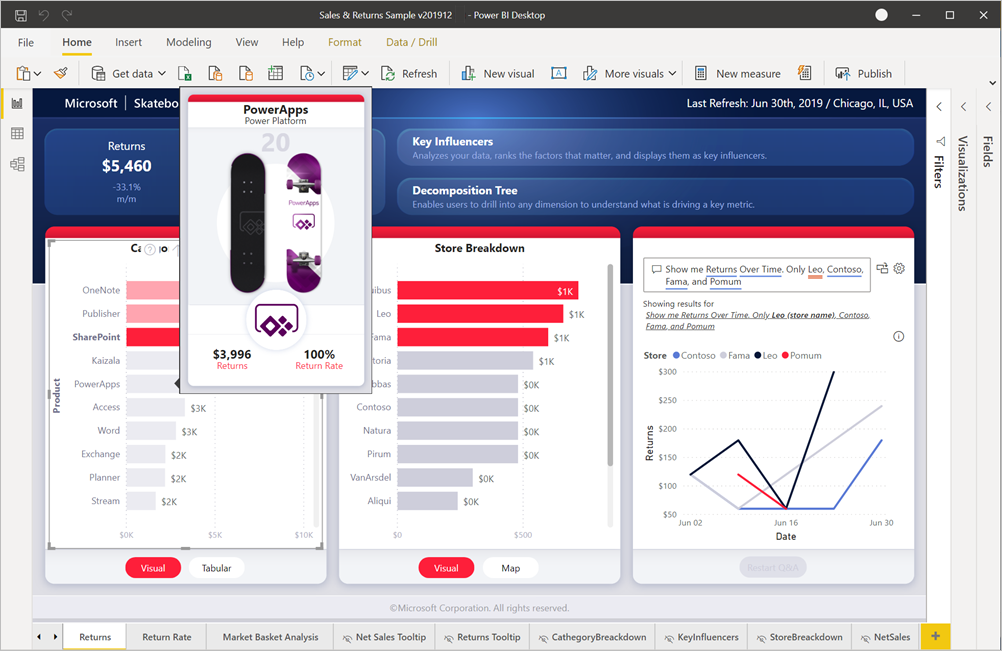
- Customer Profitability sample
- Employee Hiring and History sample

- IT Spend Analysis / Corporate Spend sample
(Microsoft provides free Power BI demo dashboards: Download Samples)
📣 Real Customer Stories (Optional)
- Heathrow Airport: Uses Power BI to optimize flight gate assignments and staff allocation.
- Adobe: Uses Power BI for real-time business operations dashboards across sales and support.
- KPMG: Built client-facing dashboards for audit and compliance work.
💬 Discussion Questions
- Which example did you find most relevant or inspiring?
- Can you think of a decision your team makes that could benefit from a dashboard?
- What data do you wish you had access to at work?
🔁 Lesson Recap
Power BI empowers industries to become more agile and insight-driven. Whether it’s streamlining internal operations or offering insights to customers, Power BI’s ability to unify and visualize data makes it a game-changer for modern business.