Objective: Understand what Power BI is and its importance in data visualization.
Content:
- Definition and purpose of Power BI
- Overview of Power BI’s capabilities
- Real-world applications and benefits
📘 Definition and Purpose
Power BI is Microsoft’s cloud-based business intelligence (BI) platform that allows users to connect to data sources, transform data, and build interactive dashboards and reports. Its purpose is to empower everyone — from business users to analysts — to make data-driven decisions.
🌐 Overview of Capabilities
-
Connects to Excel, databases, cloud services, web APIs, and more
-
Creates visualizations like bar charts, maps, KPIs, tables, and slicers
-
Enables interactive filtering, drilldowns, and real-time dashboards
-
Offers scheduled refresh, data alerts, and AI-powered insights
✅ Real-World Benefits
-
Saves time from manual reporting
-
Improves visibility into business performance
-
Enhances collaboration across teams
-
Increases data accuracy and trust in decision-making
💡 Example:
A marketing manager wants to track ad performance across Facebook, Google, and LinkedIn. Power BI lets her combine all data sources, analyze campaign ROI, and make informed budget decisions in one place.
📘 Scenario:
Carlos, an analyst at a logistics company, used to wait hours for updated shipment data. Now, he’s built a real-time dashboard in Power BI showing deliveries, delays, and regional performance. Leadership reviews it daily without needing to ask Carlos for updates.
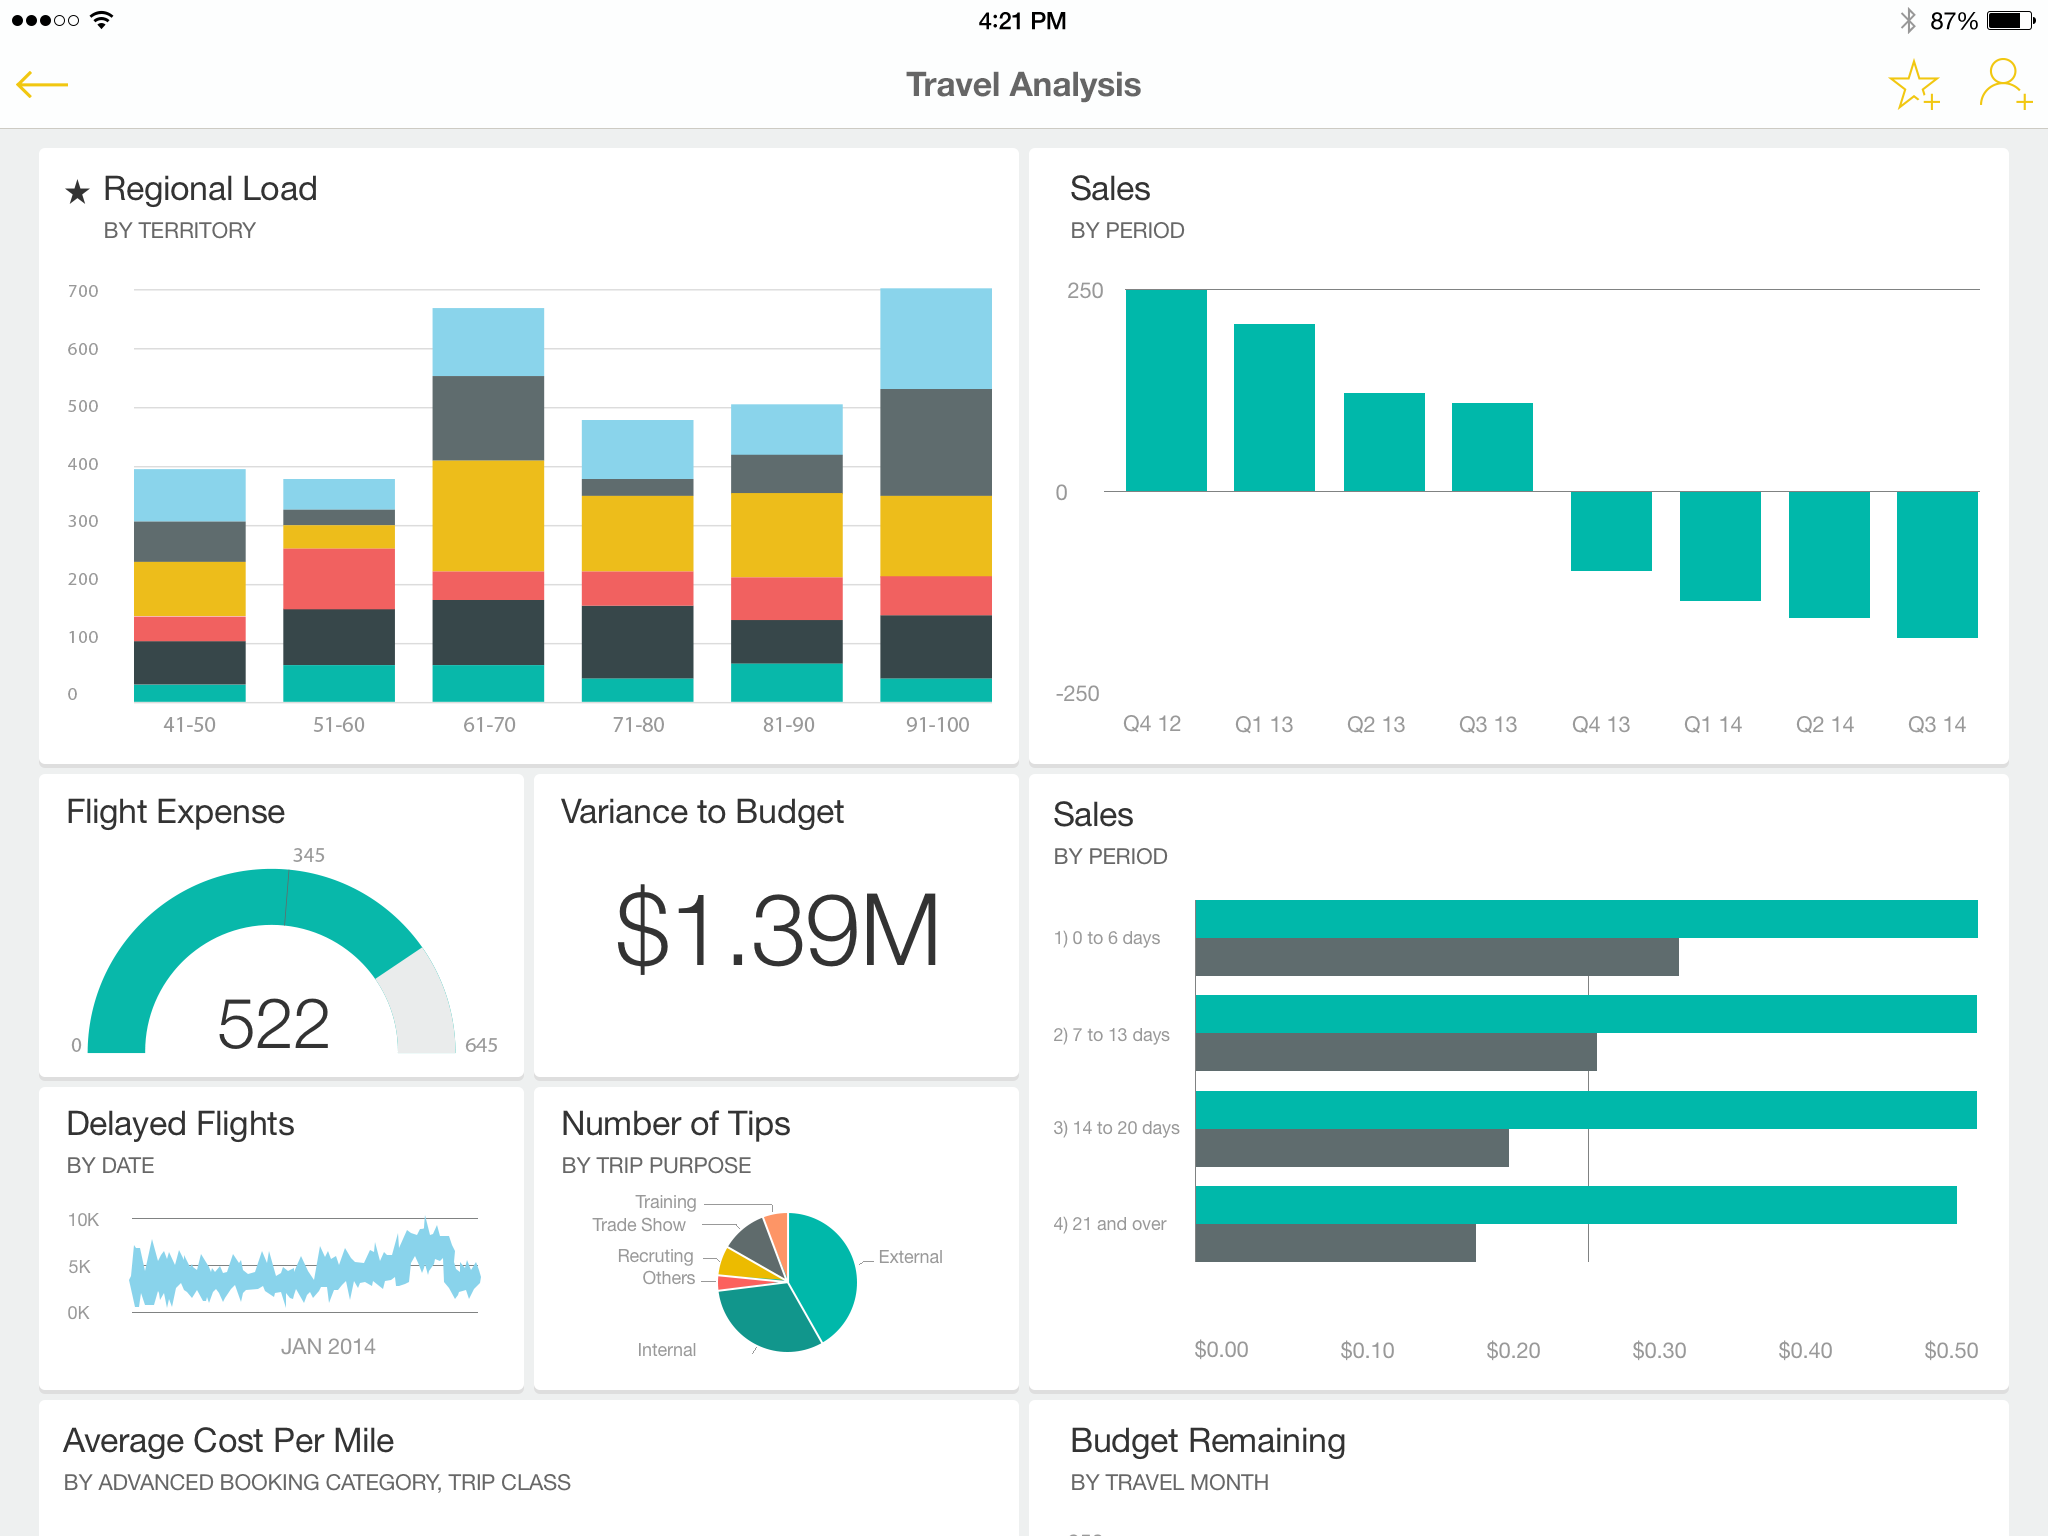
Example of a report:
🏢 Real-World Applications and Benefits
-
Sales: Monitor performance metrics and identify trends.
-
Marketing: Analyze campaign effectiveness and customer engagement.
-
Finance: Track budgets, expenditures, and financial forecasts.
-
Operations: Optimize supply chain and operational efficiency.
🌍 Insights on Power BI Adoption:
In healthcare, Power BI is being leveraged to track patient outcomes and hospital efficiency, merging data from multiple departments into a single dashboard. Similarly, in education, institutions use Power BI to monitor enrollment trends, student performance, and resource utilization, enabling more targeted interventions. The adaptability of Power BI ensures it meets the needs of diverse industries, driving better decision-making processes everywhere.
Furthermore, Power BI fosters collaboration by enabling teams to share insights seamlessly. For instance, Carlos can now schedule automated reports that notify stakeholders of potential issues before they escalate. This proactive approach not only saves time but also enhances decision-making by ensuring that everyone operates with the same up-to-date information.
As organizations increasingly adopt data-driven strategies, Power BI stands out for its ease of use and scalability. One compelling feature is its ability to integrate with other Microsoft tools like Excel, Azure, and Teams, enhancing cross-platform productivity. With its drag-and-drop capabilities, even non-technical users can create impactful visuals, bridging the gap between complex datasets and actionable insights.
Moreover, Power BI’s built-in AI features, such as natural language queries and predictive analytics, empower users to delve deeper into their data. For example, by simply typing a question, stakeholders can instantly generate insights, ensuring swift responses to emerging challenges.
Organizations are also leveraging Power BI to enhance transparency and accountability. By centralizing data into cohesive dashboards, they eliminate silos and foster a culture of informed decision-making. Government agencies, for example, have used Power BI to monitor public service efficiency, ensuring taxpayer funds are utilized optimally. Similarly, retail companies track inventory levels, sales performance, and customer preferences, adapting their strategies in real time to align with market demands.
This transformative tool not only democratizes data analytics but also scales effortlessly with organizational growth. Whether it’s a small business analyzing quarterly sales or a multinational corporation managing global operations, Power BI offers tailored solutions that grow alongside their needs. Its user-friendly interface ensures that data literacy is no longer confined to IT departments, empowering individuals across all levels to contribute meaningfully to the data narrative.
🔁 Lesson Recap: What is Power BI?
In this lesson, you learned that:
✅ Power BI is Microsoft’s business intelligence platform designed to help users turn raw data into clear, actionable insights through interactive reports and dashboards.
✅ It allows users to connect to various data sources, clean and transform data, and create engaging visualizations — all without needing to write code.
✅ Core capabilities of Power BI include data modeling, real-time dashboards, scheduled refreshes, and seamless sharing and collaboration.
✅ Power BI is used across industries — from marketing to finance — to reduce manual reporting, uncover trends, and make faster, data-driven decisions.
✅ A typical journey starts with data in Excel, which is then imported into Power BI Desktop, shaped using Power Query, visualized through charts and graphs, and finally published to the Power BI Service for others to access.