[wpcode id=”1279″]
Learn Power BI from Certified and Experienced Instructors
Power BI Training Level 1 – (8 hours) $1,200
- Introduction to Power BI:
Understanding the basics of Power BI, its interface, and how it works. - Connecting Data Sources:
Learn how to connect Power BI to different data sources, such as Excel, CSV, SQL Server, and more. - Data Modeling:
Understand the fundamentals of data modeling, including creating relationships between tables, managing data types, and creating calculated columns and measures. - Creating Visualizations:
Learn how to create various types of visualizations, including charts, tables, matrices, and more, to showcase your data effectively. - Formatting and Customizing Visualizations:
Learn how to format and customize visualizations, including changing colors, fonts, and styles, to make them more impactful. - Sharing Reports and Dashboards:
Understand how to share your reports and dashboards with others, including creating and publishing to the Power BI service, and sharing with colleagues and stakeholders. - Advanced Topics:
Dive deeper into advanced topics, such as creating complex calculations with DAX, working with Power Query, and using Power BI with Azure.
Call (972) 275-9224 or Click to schedule your Power BI class
Call (972) 275-9224 or Click to schedule your Power BI class
Power BI Training Level 2 – (8 hours) $1,200
- Review of Power BI Basics:
A quick refresher of the fundamentals of Power BI, including data modeling, creating visualizations, and sharing reports and dashboards. - Advanced Data Modeling:
Learn how to create more complex data models, including working with relationships, handling different types of hierarchies, and using advanced DAX functions. - Advanced Visualizations:
Explore advanced visualizations such as custom visuals, drill-throughs, and drill-downs to help users analyze data more deeply. - Data Transformation with Power Query:
Learn how to use Power Query to transform data into the right format for analysis, including dealing with text data, creating conditional columns, and managing data types. - Using Parameters:
Understand how to use parameters to create interactive reports and dashboards, including dynamic filtering and setting up date ranges. - Power BI Administration:
Learn how to manage Power BI workspaces, users, and data refresh, as well as how to create and manage security roles and access permissions. - Best Practices for Power BI:
Understand best practices for creating effective and efficient Power BI reports and dashboards, including data visualization best practices, report design, and performance optimization.
Note that the exact content and duration of each topic may vary depending on the specific needs of the training program and the audience
Call (972) 275-9224 or Click to schedule your Power BI class
Call (972) 275-9224 or Click to schedule your Power BI class
Power BI Packages
Starter
This package is suitable for small businesses or individuals who need a basic reporting solution.
- 1 report with up to 3 pages
- Insightful and smart visuals
- 1 data model
- Data source connectivity
- * 1h Basic support plan included
- * Automatic Report Refresh
$999
Standard
This package is designed for medium-sized businesses that require a more robust reporting solution
- 3 report with up to 3 pages
- 2 data models
- 3 dashboards
- Data source connectivity
- * 1h Basic support plan included
- * Automatic Report Refresh
$1,999
Enterprise
This package is designed for larger organizations that require an enterprise-level reporting solution
- 5 report with up to 3 pages
- 1 measure or calculated column per report
- 3 data models
- 5 dashboards with Natural Language Query
- 1 KPI per report
- * 2h support plan included
- Data source connectivity
- * Automatic Report Refresh
$3,699
Unparalleled BI Solutions

TCG helps you gain business insights from your data, which can enable your team to make better decisions. You can imagine how much time, money, and resources this saves for the company. We use Power BI, the world’s leader in BI analytics to provide you with insight into your data.
Accurate, timely reporting
Since we have a team of BI experts who are constantly learning new methods and techniques, we are able to deliver accurate reports in a timely manner. This ensures that your business is always running smoothly.
Comprehensive, personalized service
We offer comprehensive BI solutions at an affordable rate, with a dedicated account manager who will guide you through all your BI needs!
Start with a free assessment of your reporting needs and see how we can turn your Excel worksheets into beautiful interactive reports that can be shared with other business users inside or outside of your organization.
Your one-stop-shop for Power BI services in Dallas.
Power BI Services In the Plano, Frisco and DFW area

There are several ways in which we could help with Power BI reporting needs:
- Designing dashboards and reports:
We could help to design custom Power BI dashboards and reports that meet your specific reporting needs. This could involve working with you to understand your data and what insights you are looking to gain, and then creating visualizations and layouts that effectively communicate those insights. - Connecting to data sources:
We could help to connect your Power BI reports to the relevant data sources, whether they are on-premises databases or cloud-based services. This could involve setting up data import and refresh schedules, as well as configuring any necessary data transformation and cleansing steps. - Providing training:
We could provide training and workshops to help you and your team learn how to use Power BI effectively. This could include training on topics such as how to create and customize reports, how to use advanced features such as DAX calculations and Power Query, and how to share and collaborate on reports. - Ongoing support:
We could provide ongoing support to help you troubleshoot any issues that may arise and ensure that your Power BI reports are running smoothly. This could include providing assistance with data refresh and connectivity issues, as well as helping to resolve any other technical challenges that may come up.
TCG helps with your Power BI reporting needs by designing custom dashboards and reports that meet your business needs.
Here is an example of how Power BI could be used to help your business:

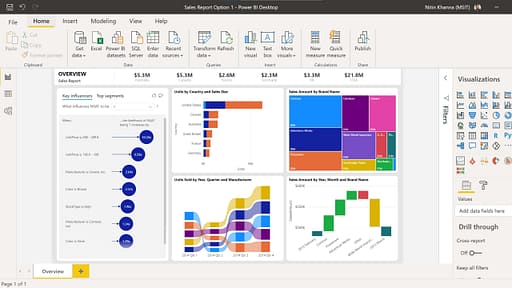
Let’s say you own a small retail store and you want to track your sales and performance over time. You could use Power BI to create a dashboard that displays key metrics such as sales revenue, average transaction value, and customer count. You could also use Power BI to create charts and graphs that show trends in your sales data over time, such as daily or monthly sales totals.
Using Power BI, you could easily see how your store is performing and identify any trends or patterns in your data. For example, you might notice that sales tend to be higher on weekends or that certain types of products are more popular at certain times of the year. With this information, you could make informed decisions about how to run your store, such as by adjusting your inventory or marketing efforts based on your data insights.
Power BI is a powerful tool for businesses looking to track their performance and make data-driven decisions
- * Basic Support: End-user or admin training (remote) – Free Microsoft Power BI links and resources
- * Automatic Report Refresh for supported Data sources such as SQL and other live databases
- Source data needs to be in machine-ready table format or actual database – additional data transformation may be needed for “unclean” data
- Customer is responsible for Power BI licensing